
Confusion Matrix & Evaluation Metrices
In the previous blog, we discussed some of the important concepts such as the Sigmoid function, Cost function and Maximum Likelihood Estimation in logistic regression.
In this blog, we will discuss some of the commonly used performance metrics for logistic regression. Once we have trained a logistic regression model on the training dataset, the next step is to evaluate its performance on the testing dataset. There are several performance metrics that can be used to evaluate the performance of the model. Let us look at each one of them and understand the concepts associated with it.
Content
- Confusion Matrix.
- Accuracy.
- Precision.
- Recall/Sensitivity.
- Specificity.
- F1-Score.
- Area Under the Receiver Operating Characteristic Curve (AUC-ROC).
- Conclusion.
Confusion Matrix
Confusion Matrix is a table or matrix-like structure that is used to evaluate the performance of a classification model. It is the visual representation of Actual vs Predicted values. For a binary classification model, the confusion matrix is a 2 × 2 matrix and looks something like below.
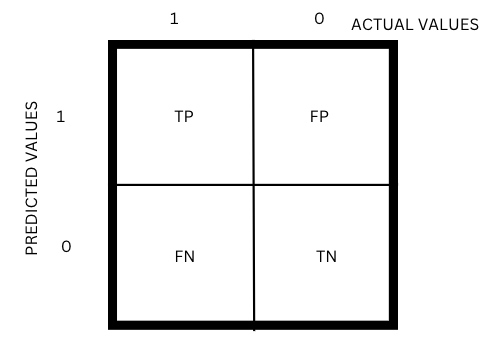 Figure-(1)
A confusion matrix for a binary classification model has four quadrants associated with it as shown in the above figure.
- True Positive (TP): True positive refers to the number of instances which are actually positive and predicted positively by the model.
- False Positive (FP): False positive refers to the number of instances which are actually negative but predicted positively by the model.Type-1 Error is FP.
- False Negative (FN): False negative means the number of instances which are actually positive but predicted negatively by the model.Type-2 Error is FN.
- True Negative (TN): True negative means the number of instances which are actually negative and predicted negatively by the model.
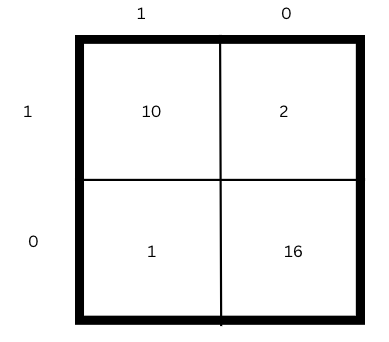
Example: Consider the confusion matrix for a classification problem of whether the person is diabetic or non-diabetic shown below.
 (Figure 2)
The four quadrants of the Confusion Matrix can be interpreted as:
- TP=10, 10 are actually diabetic and the model predicted it to be diabetic.
- FP=2, 2 are actually non-diabetic but the model predicted it to be diabetic.
- FN=1, 1 is actually diabetic but the model predicted it to be non-diabetic.
- TN=16, 16 are actually diabetic and the model predicted it to be non-diabetic.
Accuracy
Accuracy is defined as the number of correct predictions out of the total predictions made by the model.
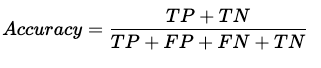
Accuracy = 26/29 (Figure 2)
Accuracy is the most common metric used for evaluating the performance of a classification model. It is a useful metric for a balanced dataset and can be misleading when the data is imbalanced.
Precision
Precision is defined as the ratio of true positives to the number of predicted positives by the model.
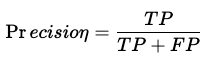
Precision = 10/12 (Figure 2)
A high precision means the number of false positives is less. This is useful when we are worried about incorrect positive predictions (FP). For example, in the case of mail spam detection, FP will be a higher concern as the wrong prediction can make the person ignore the mail even when it’s not spam.
Recall
Recall is defined as the ratio of true positives to the total number of actual positives. Recall is also called a Sensitivity/True positive rate.
Recall = 10/11 (Figure 2)
A high recall means the number of false negatives is less. This is useful when we are worried about incorrect negative predictions (FN). For example, in the case of covid, FN will be of higher concern as the actual positive case mustn't go unnoticed so that the virus doesn’t create chaos in society.
Specificity
Specificity is defined as the ratio of true negatives to the total number of actual negatives. It is also called a True negative rate.
Specificity = 16/18 (Figure 2)
F1-Score
F1-Score is the harmonic mean of precision and recall. It provides an understanding of both Precision and Recall metrics by considering them together.
F1 Score gives a combined idea of both precision and recall. It is useful when we are concerned equally about FP and FN.
Area Under the Curve Receiver Operating Characteristic Curve (AUC-ROC):
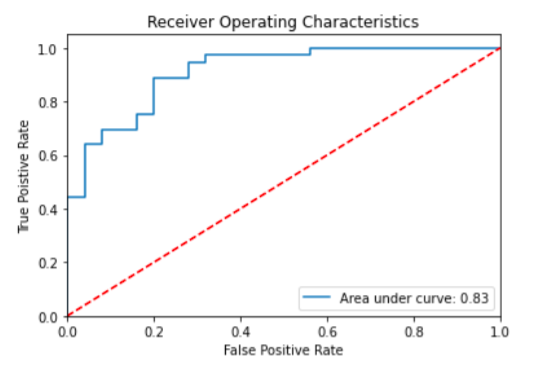
The Receiver Operator Characteristic (ROC) curve is a tool used to evaluate the performance of binary classification models. It represents a probability curve that shows how well the model can separate the positive and negative classes.
The curve is created by plotting the True Positive Rate (TPR) against the False Positive Rate (FPR) at different threshold values.
The Area Under the Curve (AUC) is a measure derived from the ROC curve that signifies the model's ability to distinguish between the classes.
A higher AUC indicates better performance in correctly identifying positive and negative instances.
When the AUC is equal to 1, the classifier can perfectly differentiate between all positive and negative instances. Conversely, an AUC of 0 means the classifier cannot distinguish between the classes and predicts randomly or consistently misclassifies instances.
For AUC values between 0.5 and 1, the classifier has a higher chance of correctly identifying positive and negative instances. This indicates that it can detect more true positives and true negatives compared to false negatives and false positives.
In summary, the AUC value of a classifier serves as a measure of its ability to distinguish between positive and negative classes, with higher values indicating better performance.
Conclusion
In conclusion, several performance metrics can be used to evaluate the performance of a logistic regression/Classification model. The choice of metric depends on the problem statement and the analysis objective.
Accuracy is the most common metric used for evaluating a logistic/classification regression model although it can give erroneous predictions in case of an imbalanced dataset. Therefore it is always recommended to use a combination of metrics to get a more detailed overview of the model’s performance.