Prerequisites:Python IDE-Jupite Notebook,VS Code,Pycharm etc.
Drawing a Linear Regression Line using Python
Importing Essential Libraries:
#Importing numpy for computations
#Importing matplotlib for visual representation

import numpy as np
import matplotlib.pyplot as plt
Function for estimating coefficients b0,b1 in Y=b1*X+b0
def estimate_coefficients(x,y):
    n = np.size(x)
    mean_x, mean_y = np.mean(x), np.mean(y)
    SS_xy = np.sum(y*x - n*mean_y*mean_x)
    SS_xx = np.sum(x*x -n*mean_x*mean_x)
    b1 = SS_xy /SS_xx
    b0 = mean_y - b1*mean_x
    return(b0,b1)
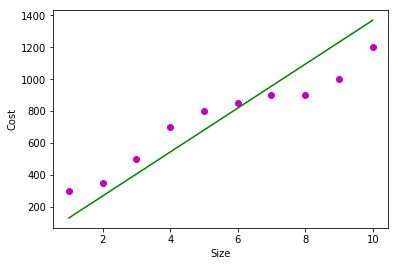
Function for plotting the Linear Regression Line
def plot_regression_line(x,y,b):
    plt.scatter(x,y,color = 'm',marker="o")
    y_pred = b[0]+b[1]*x
    plt.plot(x,y_pred,color = 'g')
    plt.xlabel('Size')
    plt.ylabel('Cost')
    plt.show()
Creating Random Data
x = np.array([1,2,3,4,5,6,7,8,9,10])
y = np.array([300,350,500,700,800,850,900,900,1000,1200])
Calling the coefficients function & displaying the output
b = estimate_coefficients(x,y)
print("Estimated Coefficients: \nb0 = {} \nb1 = {}".format(b[0],b[1]))
Output
Estimated Coefficients:
b0 = -7.5
b1 = 137.72727272727272
Plotting the linear regresion line for the data
plot_regression_line(x,y,b)